
Australian Food System Policy Dashboard
Meeting growing aspirations for Australia’s future food system is going to depend, at least in part, on more coherent and connected policy across the range of sectors and actors involved in the food system. Policy coherence (i.e. the alignment and integration across sectors to achieve shared goals, see FSH brief) can support deeper coordination across portfolios, as well as enable the anticipation and management of ‘surprising’ emergent interactions from the food system. Mapping the various policies that are currently shaping the Australian food system is a first step towards enabling greater policy coherence. To support this, the Australian Food System Policy Dashboard offers an interactive platform that maps current federal policies influencing the food system.
About the dashboard
The dashboard is an interactive tool that can be used to visualise and explore the various Federal level policies shaping the Australian food systema. It maps 56 individual policy activities across 12 federal portfoliosb according to two primary aspects: 1) the food system activity that the policy directly influences (‘Policy Activities’), 2) the food system outcome the policy aims to achieve (‘Policy Outcomes’).
- High-level food system activities considered in the mapping include the enabling environment, food supply system, business services, food environment and consumer characteristics.
- High level food system outcomes include economy, environment, social and health and nutrition outcomes.
Both food system activities and food system outcomes are further broken down into second tier categories.
How to use the dashboard
- To see how a particular policy activity links with policy outcomes, select from the Policy Activities drop-down menu or click on the coloured nodes on the Sankey diagram. The dashboard presents the linkages between activities and outcomes through a Sankey diagram, supported by detailed results that describe individual policies included in your query.
- Second tier activities and outcomes selected will be shown. For example, within the food supply system, you can look at agricultural production or food processing policies among others. Similarly, within environmental outcomes, you can examine policies that focus on biodiversity or greenhouse gas emissions among others.
- Hover over the ‘flows’ of the result to find out how many policies map a particular activity to an outcome.
- Additional aspects that can be used to ‘filter’ and explore policies include the responsible portfolio, the target population for the policy, and the type of policy (regulation, strategy, voluntary guideline etc). This provides a starting point for the exploration of synergies as well as potential conflicts in policy activities and food system outcomes.
Who is the dashboard for?
The dashboard is intended for use by policy makers, researchers, industry and civil society groups. Its serves as a first step in identifying relevant food system policies across diverse portfolios and their points of intersection across food system activities and outcomes. The dashboard also demonstrates how a simple, visual and interactive tool allows the user to begin to navigate a complex policy landscape. This type of tool has many potential applications in other complex systems and areas of policy (see section on ‘Next Steps’).
Use cases
Open allClose allIn terms of food system activities; all policies identified targeted the food supply system (encompassing agricultural production/fisheries, storage, transport, processing, retail and consumption), with 43 policies targeting the enabling environment in which the food supply system operates (including institutions and infrastructure, see Figure 1). The food environment is targeted by 38 policies, consumer characteristics by 34 policies, and 22 policies target the business services related to food systems.
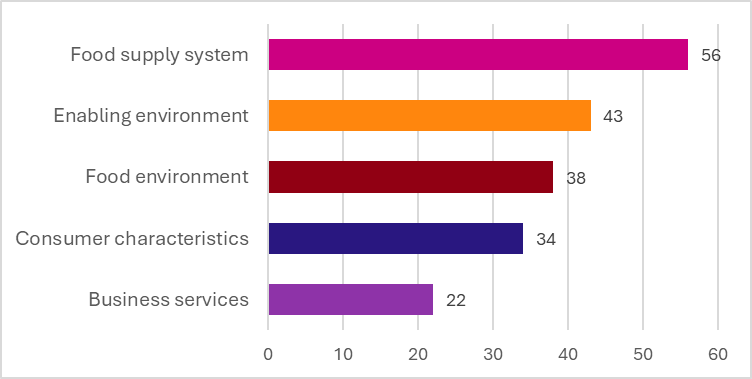
Figure 1. Distribution of food system activities targeted by identified policies (n=56)
In terms of food system outcomes; the majority of policies were focused on economic outcomes (40/56), followed by health and nutrition outcomes (29/56), environmental outcomes (28/56), and social outcomes (17/56) which are the least represented (see Figure 2).
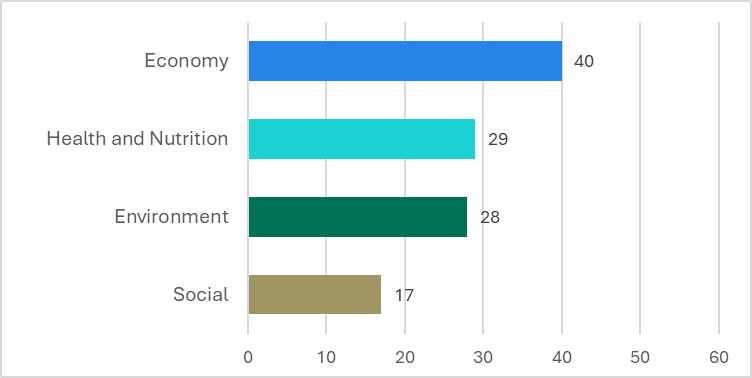
Figure 2. Distribution of food system outcomes targeted by identified policies (n=56)
The dashboard includes filters that allow users to explore relationships between policy activities and outcomes based on set criteria. For example, filtering by Target Population shows that different groups are linked to different policy activities and policy outcomes.
- The majority of policies aimed at children are health and nutrition policies (19/22), followed by economic policies (11/22), and social and environmental outcomes (6/22 each). These policies are mainly concerned with food environment, consumer characteristics, and food supply systems.
- Policies relating to Aboriginal and Torres Strait Islander Peoples are evenly distributed across economic, environmental, social, and health outcomes (11,11, 9, 7 of 18 respectively), with policy activities mainly concerned with the food supply system (18/18) and enabling environments (13/18).
Further insights can be generated from combinations of filters or drilling down into second-tier categories of activities and outcomes.
There are nine federal portfolios responsible for 38 policy activities shaping food environments. These activities are evenly distributed across economic and health and nutrition goals (25/38 for each), with fewer directed at environmental (15/38) or social outcomes (12/38). This highlights the diversity of portfolios that shape specific aspects of food systems and the importance of appropriate coordination mechanisms when considering changes in specific policy areas.
The central agencies (including the Department of Prime Minister and Cabinet, Treasury and Finance departments) are responsible for 7 (out of 56) food system policy activities. All of these activities are focused on economic outcomes (7/7), with fewer policies influencing environmental (3/7), health and nutrition (2/7) and social outcomes (2/7).
Find out more
Open allClose allRelevant food system policies were identified through existing literature and web searching. Two recent systematic reviews were used to provide the baseline list4,5, and this was supplemented with additional web searches to identify new policies that have since come into effect (up to June 2025). Food system activities and outcomes were based on existing food system frameworks – see glossary3,6. Mapping of each policy was completed by the first two authors of this brief and validated by a third researcher. Policy types were based on Australian government typologies used for guidance on regulatory and policy impact analysis1,2.
Each individual policy can map to multiple food system activities (e.g. the enabling environment and business services) and outcomes (e.g. health and social outcomes), so totals are greater than 56. Similarly, many policies contain multiple activities that include more than one form of approach to governance, regulation, or action, meaning a single policy can receive multiple policy type classifications.
Only policies that were directly related to food system activities or outcomes as per above mentioned frameworks were included. The included policies are not necessarily an exhaustive list of all relevant food system policies and there is scope to include additional policies in future revisions of the dashboard. No distinction was made between a policies primary focus or outcome compared to a secondary or minor activity or outcome. This was done intentionally to allow for exploration of maximal synergies across policies and to minimise subjectivity (if any policy mentioned a food system activity or outcome, this was included in the mapping – see glossary).
Only policies that were directly related to food system activities or outcomes as defined by the above-mentioned frameworks were included. The included policies are not necessarily an exhaustive list of all relevant food system policies; however, it provides a strong foundation and there is scope to include additional policies in future revisions of the dashboard. Mapping of policies is based on the content of the policy document in terms of intention. The mapping does not consider how well any specific policy is being implemented or is achieving desired impacts – though this would be a useful expansion of the policy dashboard in future.
Read more:
- Analysing for policy coherence.
- Policy Coherence as part of the state of Australia’s food system
The initial aim of this tool was to quickly generate collections of food system policies on given areas of interest that cuts across all relevant departments of Federal government. This provides a first step towards more granular analysis of policies that could be used to assess coordination and coherence between policies across departments. The design of the dashboard provides a high level of flexibility for adding additional policies as well as criteria for cross-cutting analysis. This makes it adaptable for including a greater breadth of policy interests, such as sustainability more broadly. Incorporating state and local government policies would enable assessment of vertical coordination and coherence between policy areas. The tool could also be adapted for other complex policy areas and different levels of government such as circular economy, environmental policy, or renewable energy. We welcome feedback and suggestions on how to improve the content and usability of the dashboard
Food System Activities
Food system activities reflect all the processes in the lifecycle of the production, processing, transport, marketing, retail, and and consumption of food, and the waste management involved at each stage6.
| Food System Activities | Definition | Second Tier Activities |
|---|---|---|
| Enabling Environment | The food supply system is imbedded in an enabling environment that creates the conditions in which the system functions. Transport, regulation, institutions and research infrastructure are part of this environment. | – Transport Networks – Regulations – Research Infrastructure – Institutional arrangements |
| Food Environment | The food environment comprises a number of determining environmental factors, such as the extent to which a product is advertised or the information on labels or quality seals determines the consumer’s relationship to that product. | – Food Labelling – Nutrient Quality and Taste – Physical Access to Food – Food Promotion |
| Food Supply System | The value chain is at the heart of the food supply system: value is added in each step of the chain, from production, storage and transport, and processing, to retail and consumption. | – Food Retail and Provisioning – Food Consumption – Food Processing and Transformation – Agricultural Production / Aquaculture / Fishing – Food Storage, Transport and Trade |
| Business Services | Business services, while not at the heart of the food value chain, provide services and goods to the actors in the chain. This can involve training, agricultural inputs, technical support or financial services. | – Extension Services – Agro-chemical Providers – Technological Support – Financial Services |
| Consumer Characteristics | The characteristics of consumers, who – through their knowledge, available time, resources (purchasing power), age, sex, culture, religion, etc. – develop certain preferences that influence their food choices. | – Knowledge – Time – Purchasing Power – Preferences |
Food System Outcomes
Food system outcomes are the effects that emerge from food system activities. In food systems, feedback loops between activities and outcomes create drivers that maintain or change the functioning of the food system3.
| Food System Outcomes | Definition | Second Tier Outcomes |
|---|---|---|
| Economics | Economic outcomes refers to the results and impacts of the food system on different parts of the economy including trade, labour, and businesses. | – Trade / Markets – Labour / Wages – Income / Profits |
| Health and Nutrition | Health and nutrition outcomes reflect how food system activities affect the safety of food and health status of individuals, groups, and populations. | – Food Safety – Healthy Diets – Obesity / Non-communicable Diseases |
| Environment | Environmental outcomes relate to the range of different effects on the environment that are generated by food system activities. | – Land & Soils – Fossil Fuels / GHGe – Biosecurity – Biodiversity – Animal Welfare – Climate – Food Waste |
| Social | Social outcomes reflect how the functioning of the food system affects the security, work, routines, relationships, culture, and empowerment that shape the lives of individuals, families, groups, communities, and populations. | – Food Security – Livelihoods – Equity |
Policy Types
The list below is generated for the purpose of guiding language and usage for this dashboard. There is currently no definitive typology for Australian policy though guidance can be found through some Federal government documentation1,2. These definitions do make distinctions between legally and non-legally binding arrangements but are not exhaustive of all the different types of policy instruments available for government.
| Policy Type | Definition |
|---|---|
| Legally binding regulations | Regulations that are legally enforceable |
| Non-binding guidelines, voluntary schemes or devolved to states | Government supported guidelines, voluntary arrangements, and governance processes that are not bound by law, including voluntary schemes, and policy recommendations devolved to states. |
| Market-based solutions | Policies that aim to achieve desired outcomes by facilitating the market6 |
| Education campaigns | Policy that involves raising awareness of a particular topic |
| Self-regulation | Rules and codes of conduct formulated and enforced by industry1,2 |
| Quasi-regulation | Government influences non-mandatory arrangements adopted by industry1,2 |
| Co-regulation | Arrangements are enforceable but are generally managed by industry1,2 |
| Direct regulation | Government prescribes arrangement and can enforce compliance of regulations1,2 |
| Strategy | An overarching plan linking one or more policy goals to a set of approaches for delivery |
| Government action | Policies that involve specific government actions e.g. monitoring, statistics, research, infrastructure |
List of acronyms
Below are a list of Federal Government portfolio acronyms used in this dashboard.
| ACCC | Australian Competition and Consumer Commission |
| ACMA | Australian Communications and Media Authority |
| ATO | Australian Taxation Office |
| DAFF | Department of Agriculture Fisheries and Forestry |
| DCCEEW | Department of Climate Change, Energy, Environment and Water |
| DESE | Department of Education, Skills and Employment |
| DFAT | Department of Foreign Affairs and Trade |
| DHAC | Department of Health and Aged Care |
| DISER | Department of Industry, Science and Resources |
| DITRDCA | Department of Infrastructure, Transport, Regional Development, Communications and the Arts |
| DSS | Department of Social Services |
| FSANZ | Food Standards Australia and New Zealand |
| PMC | Department of the Prime Minister and Cabinet |
- Commonwealth of Australia (2020). Department of the Prime Minister and Cabinet, The Australian Government Guide to Regulatory Impact Analysis. Canberra. Retrieved from https://oia.pmc.gov.au/
- Commonwealth of Australia (2023). Department of the Prime Minister and Cabinet, The Australian Government Guide to Policy Impact Analysis. Retrieved from Canberra, ACT: https://oia.pmc.gov.au/
- HLPE. (2017). Nutrition and food systems. A report by the High Level Panel of Experts on Food Security and Nutrition of the Committee on World Food Security. Retrieved from Rome: https://www.fao.org/cfs/cfs-hlpe/publications/hlpe-12
- Naudiyal, P., Reeve, B., Jones, A., & McDonald, S. (2021). Food policy in Australia: The role of different Federal Government organisations. The University of Sydney, Sydney.
- Ribeiro de Melo, P., Baker, P., Machado, P. P., Howse, E., Slater, S., & Lawrence, M. (2024). An analysis of the transformative potential of Australia’s national food policies and policy actions to promote healthy and sustainable food systems. Public Health Nutr, 27(1), e75. doi: https://doi.org/10.1017/s1368980024000478
- van Berkum, S., Dengerink, J., & Ruben, R. (2018). The food systems approach: sustainable solutions for a sufficient supply of healthy food. Retrieved from The Hague: https://research.wur.nl/en/publications/the-food-systems-approach-sustainable-solutions-for-a-sufficient-
To cite the dashboard
Bogard, JR; Farr, J; Lewis, M; Huynh, C; Lim-Camacho, L; Nelson, R. 2025. Australian Food System Policy Dashboard. v1. CSIRO. Service Collection. http://hdl.handle.net/102.100.100/709882?index=1
To cite the dataset
Bogard, JR & Farr, J. 2025. Food system policy mapping. v1. CSIRO. Data Collection. https://data.csiro.au/collection/csiro:66035
We would like to acknowledge the contributions of David Reynolds, Diana Romano, and Yuba Subedi for their review of the dashboard content.
Contact
Dr Jessica Bogard, Senior Research Scientist, CSIRO
Dr Jeremy Farr, Postdoctoral Research Fellow, Food System Horizons, CSIRO
a The dashboard includes active policies as of June 2025.
b The dashboard lists these 12 portfolios and three additional statutory authorities (ACCC, ACMA and FSANZ) which fall within the remit of the included portfolios (Treasury, DITRDCA and DHAC respectively).